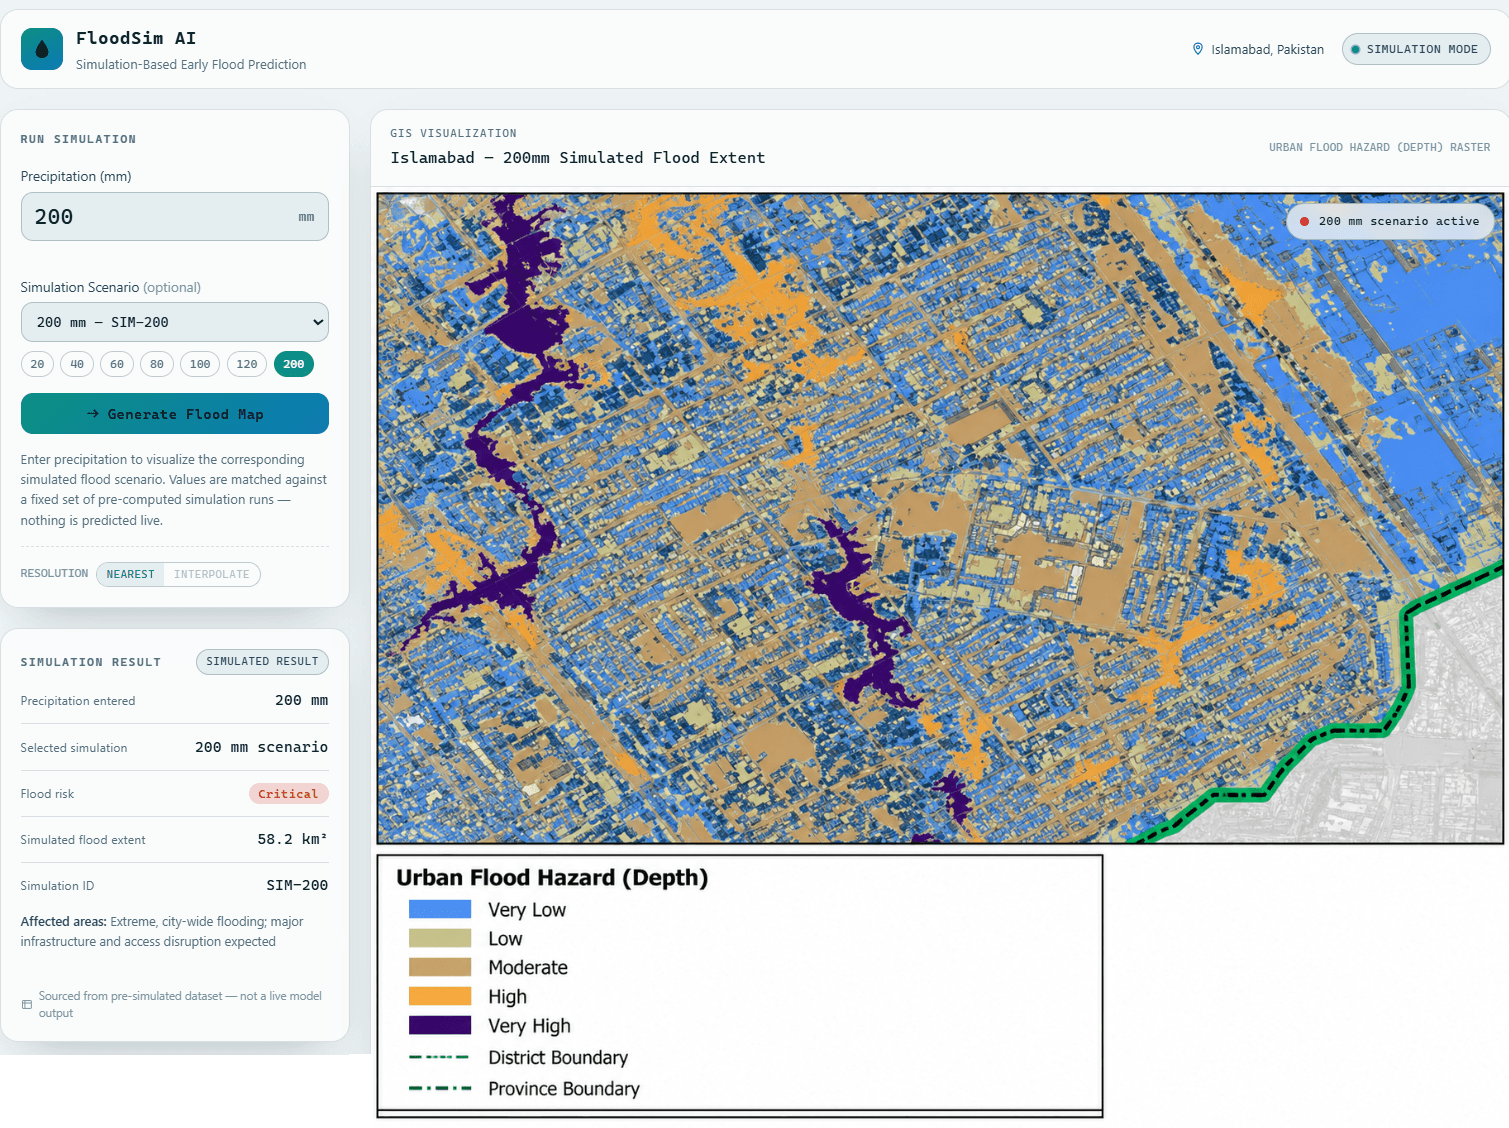
Communicating flood hazard clearly to a non-technical audience is often harder than producing the hazard model itself — dashboards either oversimplify into a single risk color or bury the reader in raw model output. FloodSim AI was built as a frontend prototype exploring a middle path: let a user enter a precipitation total and see the closest matching pre-simulated flood-hazard scenario for Islamabad, with the interface explicit about the fact that it is retrieving a matched scenario rather than running a live prediction.
The prototype resolves an entered precipitation value (mm) against a fixed simulation dataset using nearest-match logic, structured so a future version could interpolate between runs rather than only snapping to the closest one. The matched result surfaces as a GIS-style flood-hazard raster with a depth-based legend (Very Low to Very High), alongside a stats panel showing the precipitation entered, the matched scenario, risk level, simulated flood extent in km², and a simulation ID — so the provenance of every number on screen stays traceable.
A separate reference panel shows Islamabad's historical rainfall-intensity classification (mm/hr), deliberately kept apart from the event-depth scenario matcher so long-term climatology and single-event simulation results are never conflated on screen.
Built as a single self-contained HTML file — vanilla JavaScript, no external dependencies or live model calls — with a dark glassmorphism GIS/instrument-panel aesthetic and full light-mode support.
Methodology
Built a single-file HTML/CSS/vanilla JavaScript dashboard that matches a user-entered precipitation total (mm) against the nearest available run in a fixed flood-simulation dataset for Islamabad, then renders the corresponding pre-computed flood-hazard raster with a depth-based legend (Very Low to Very High). The scenario-matching logic is structured to support interpolation between runs in a future iteration, rather than only nearest-neighbor snapping. A separate historical rainfall-intensity reference panel (mm/hr) is kept functionally isolated from the event-depth scenario matcher to avoid conflating long-term climatology with single-event simulation output.
Results & Outcomes
- Built a precipitation-input interface that resolves to the nearest matching pre-simulated flood-hazard scenario from a fixed dataset
- Delivered a GIS-style hazard raster viewer with a depth-based legend and a per-scenario stats panel (risk level, flood extent, simulation ID)
- Kept the historical rainfall-intensity reference panel functionally separate from the event-depth scenario matcher to avoid conflating climatology with simulation results
- Shipped as a fully responsive, dependency-free single HTML file with dark glassmorphism and light-mode support
Challenges
Because the dashboard matches user input to the nearest pre-computed scenario rather than running a live model, the interface needed to make that distinction obvious rather than implying real-time prediction. The result panel surfaces the matched simulation ID and the precipitation entered alongside the matched scenario's own value, so a nearest-match lookup is never mistaken for a live forecast.