Floods on the Chenab recur most years at the onset of monsoon and peak summer glacier melt — the Jhelum-Chenab system peaked at 24,380 m³/s in September 2014 — and the regional flood forecasting directorate needed defensible return-period estimates for protection and reservoir planning rather than relying on institutional memory of past severe events.
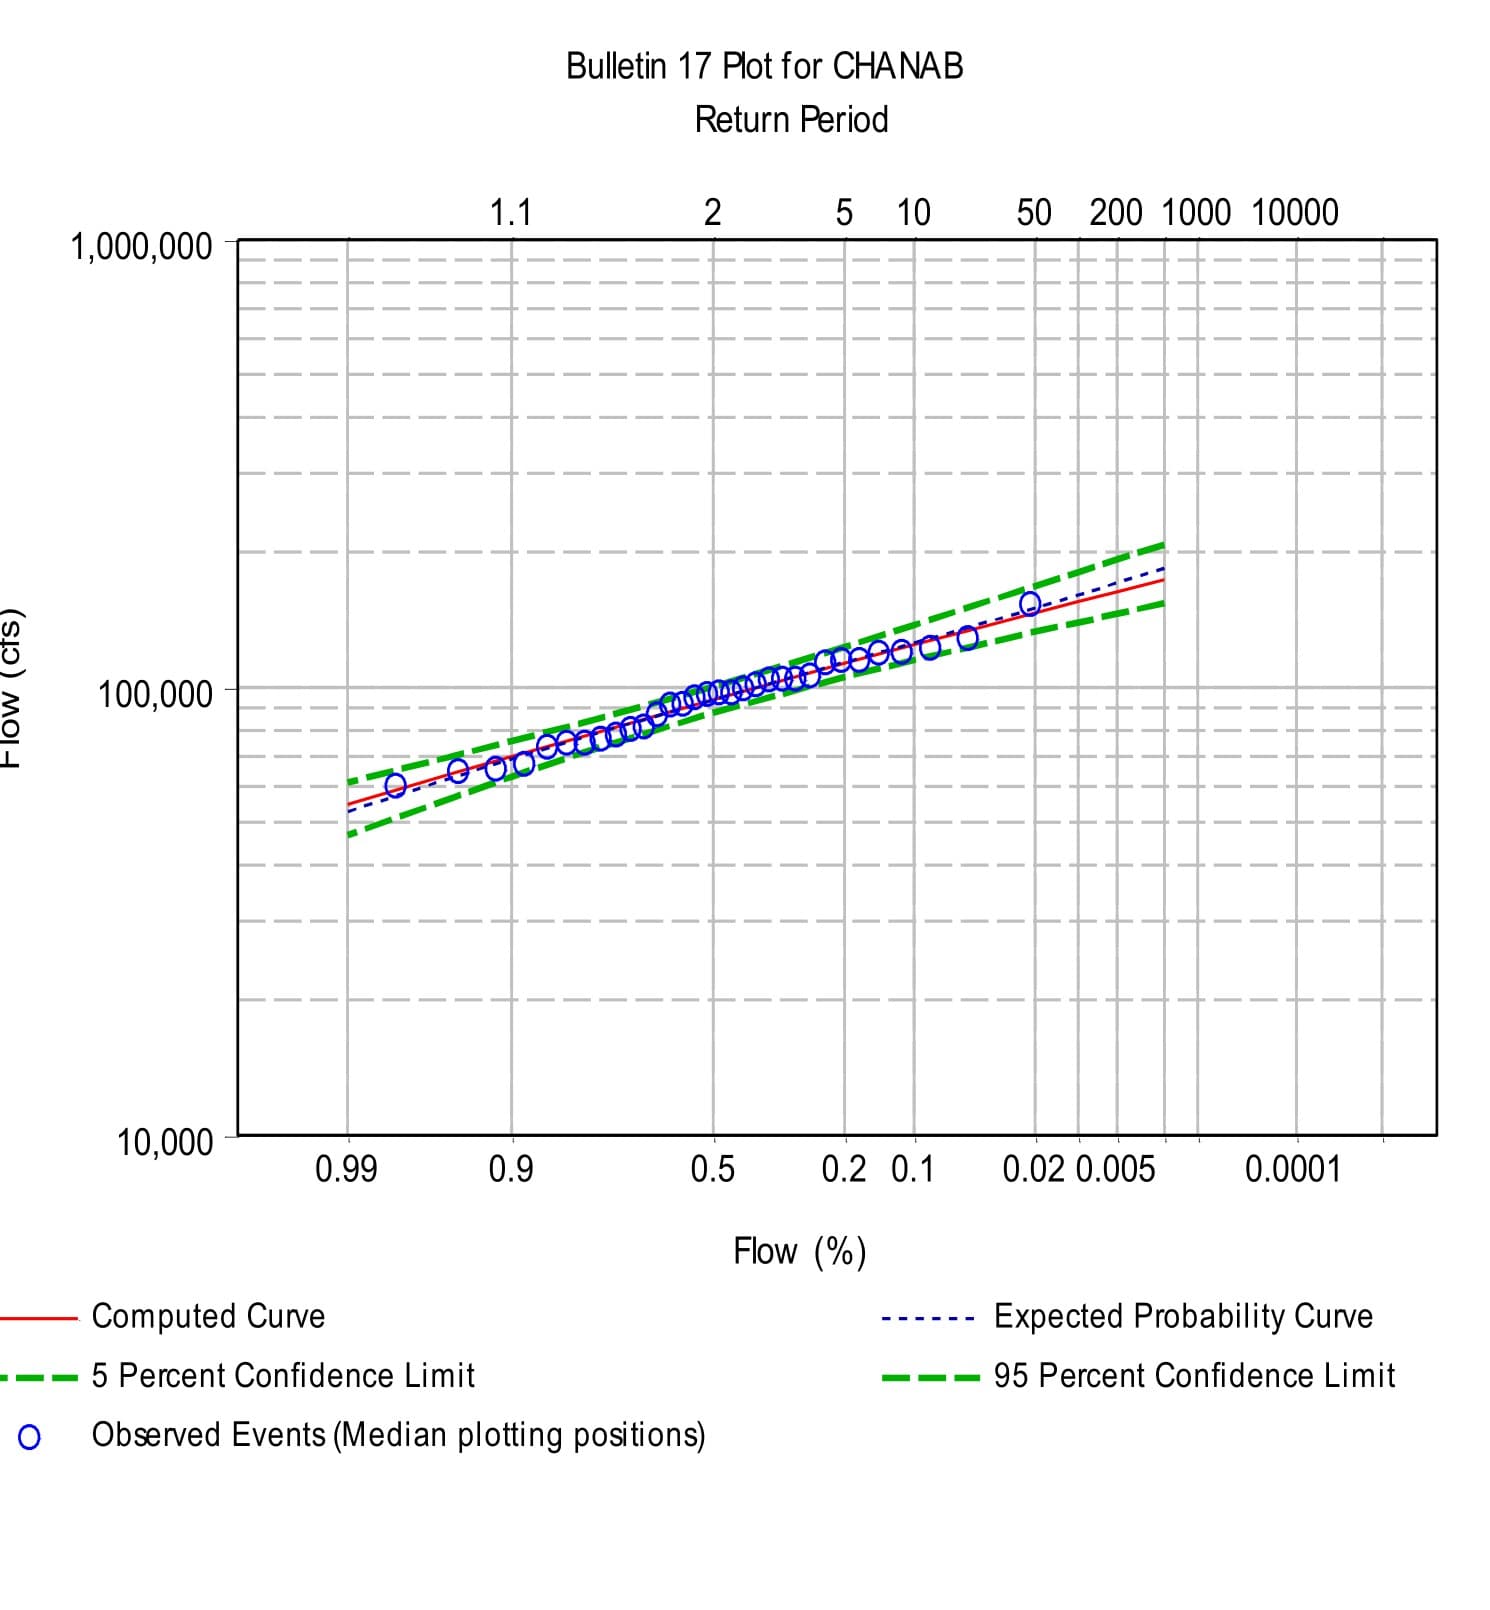
GeoVeris ran a flood-frequency analysis in HEC-SSP using the Bulletin 17-B Log-Pearson Type III procedure on 32 years (1979-2010) of annual maximum discharge at Marala, producing a flow-frequency curve with 5% and 95% confidence limits and cross-classifying flood magnitude into the region's existing High, Very High, and Exceptionally High discharge tiers.
The fitted curve showed the largest flood on record corresponds to roughly a 50-year return period, with observed annual peaks tracking the computed curve closely and staying within the confidence band across the full record — giving the directorate a statistically grounded answer to a question it had previously only been able to answer anecdotally.
The flow-frequency curve and classification are now used directly in the directorate's flood protection and reservoir planning process.
Methodology
Performed a flood-frequency analysis on 1979-2010 annual maximum discharge at Marala (WAPDA) using HEC-SSP's Bulletin 17-B procedure, fitting a Log-Pearson Type III distribution to the observed peak series and computing 5% and 95% confidence limits around the computed flow-frequency curve. Cross-classified historic and projected flood magnitudes against three discharge-based severity classes (High, Very High, Exceptionally High) already in regional use, to keep return-period outputs directly actionable for flood protection planning.
Results & Outcomes
- Fit a Log-Pearson Type III flow-frequency curve to 32 years (1979-2010) of annual peak discharge at Marala
- Found the largest flood on record corresponds to roughly a 50-year return period
- Confirmed observed annual peaks track the computed curve within the 5-95% confidence band across the full record
- Classified flood magnitude into High (200,000-399,000 cusecs), Very High (400,000-599,000 cusecs), and Exceptionally High (600,000-800,000 cusecs) tiers for direct planning use
Challenges
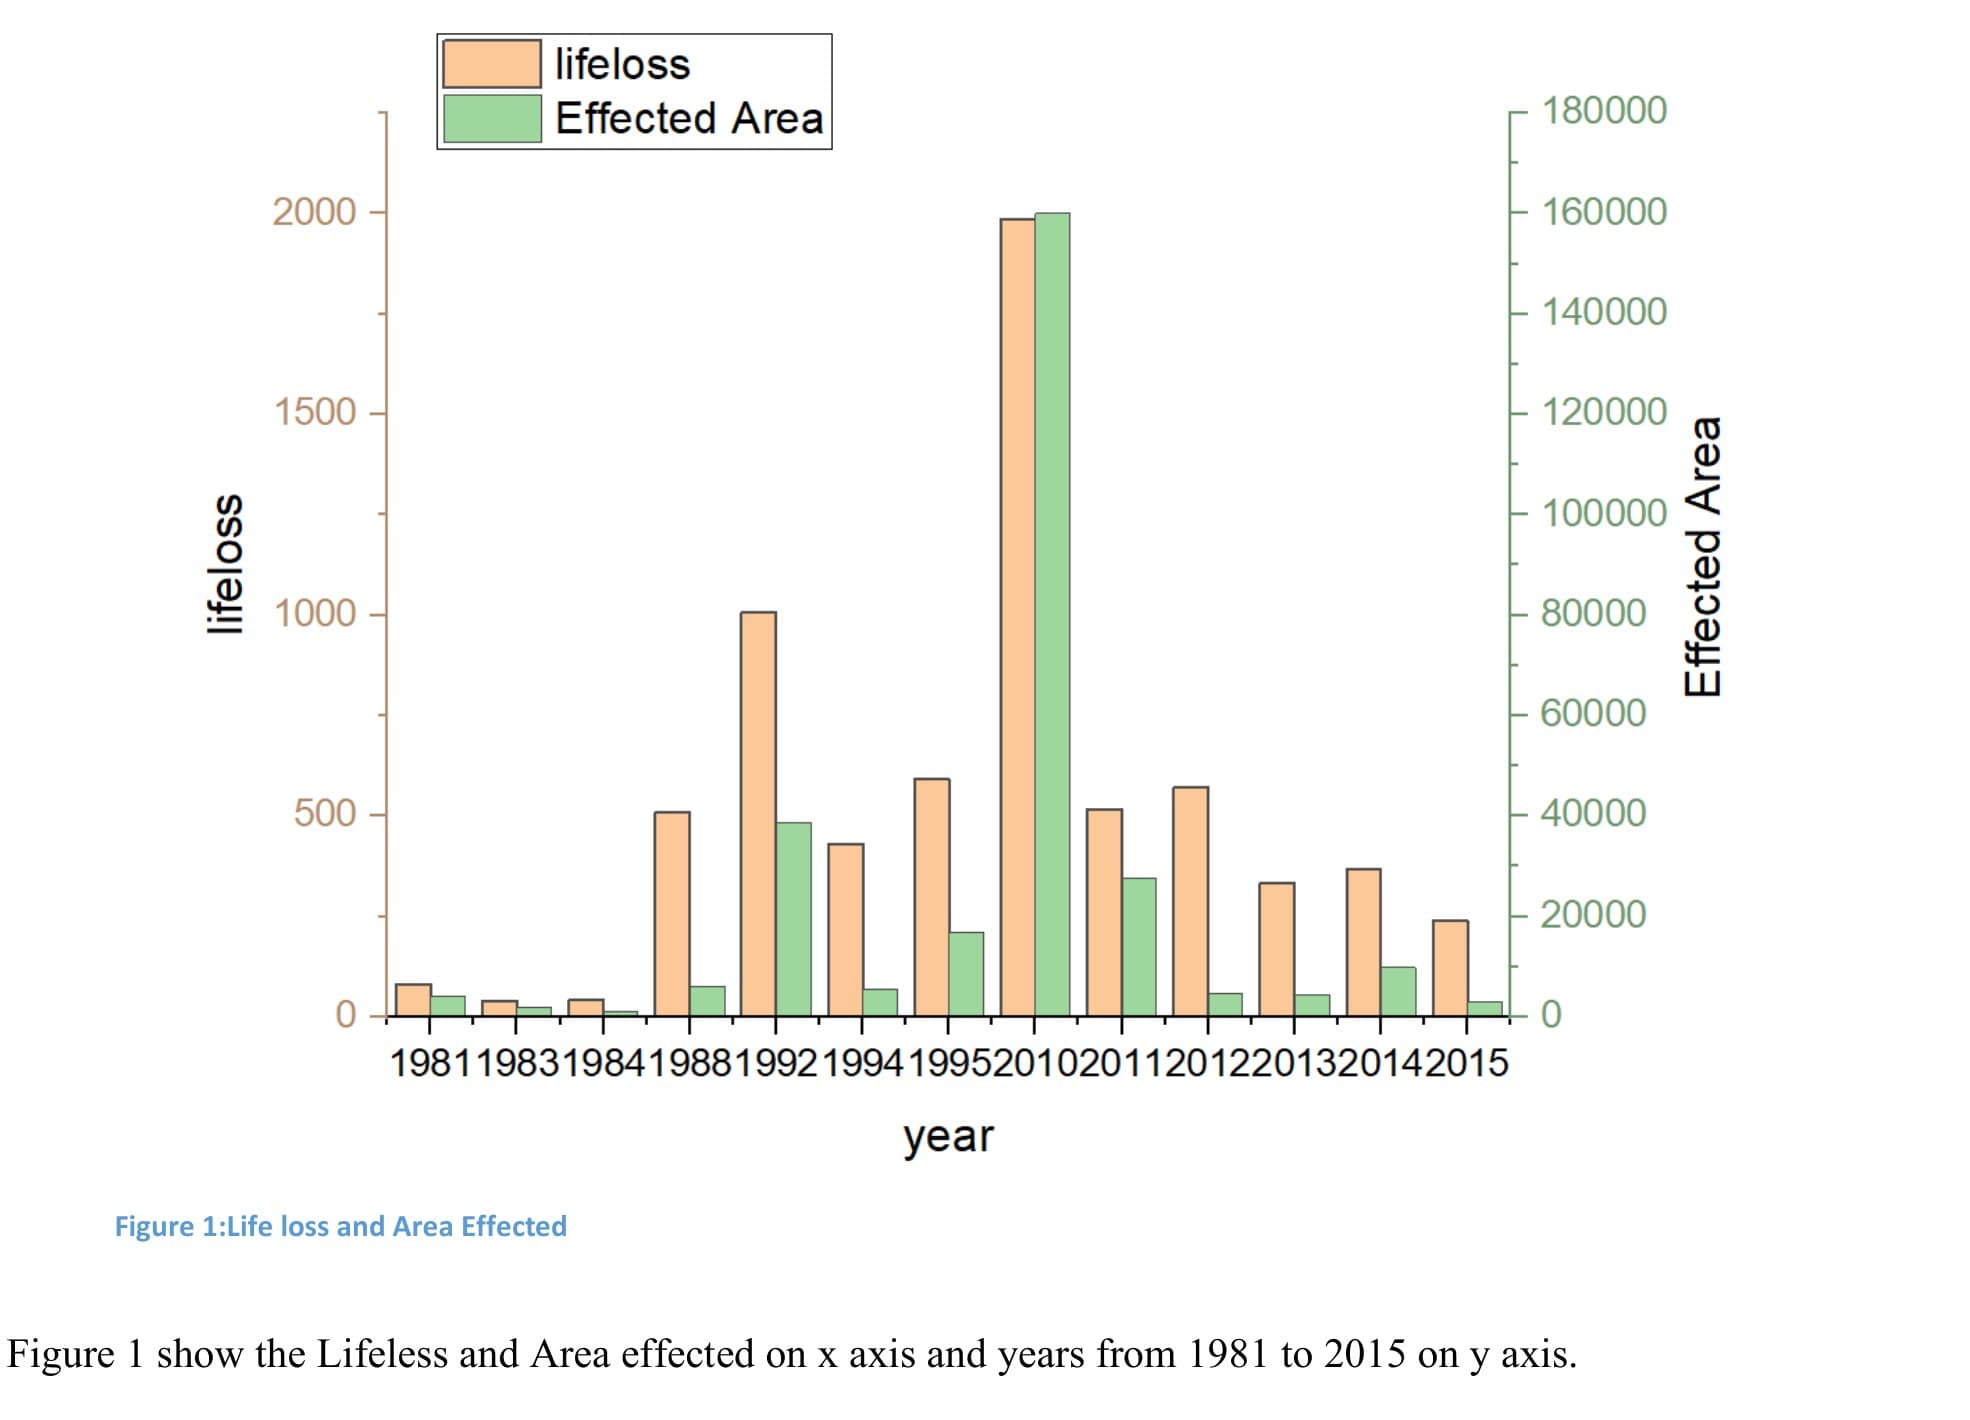
The conventional annual-maximum series used in Bulletin 17-B analysis can both miss secondary high-discharge peaks within a year and include comparatively low peaks simply because they were that year's maximum. Given the Chenab's combined monsoon-and-glacier-melt flood regime, results were cross-checked against the historic record's known severe-flood years (1988, 1992, 2010, 2014) to confirm the fitted curve was not underweighting the basin's most damaging events.